With the new school year fast approaching, teachers will soon be turning their attention to planning. With densely packed curriculums, full classes and the prospect of snap school closures, there's a heap to consider... but when it comes to school analytics, where to start? As an English teacher, turned Analytics Guy, I want to give you my five approaches for using data analytics while you review your instructional material.
The suggestions that follow are ordered by the time of year you might use them, beginning with the commencement of the school year. Like a funnel, the first suggestions look at data that relays information about long spans of time and we end with data that's useful for shorter-term decision-making.
Over the summer break
Getting to know your classes
Alongside any transition information you've received about your incoming students with particular needs, I'd want a sense of strengths and challenges in the class so that my initial instructional materials are best suited to meet them where they are.
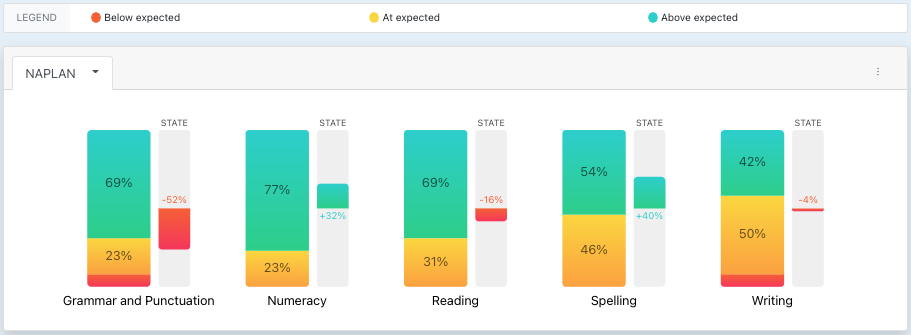
Starting with NAPLAN and then moving onto ACER or Allwell (depending on whether your school runs these tests) I'd want to understand my class's levels of Literacy and Numeracy. How does the class compare to their year level cohort? How does their rate of growth against each Domain within Literacy and Numeracy compare to the State's rate of growth?

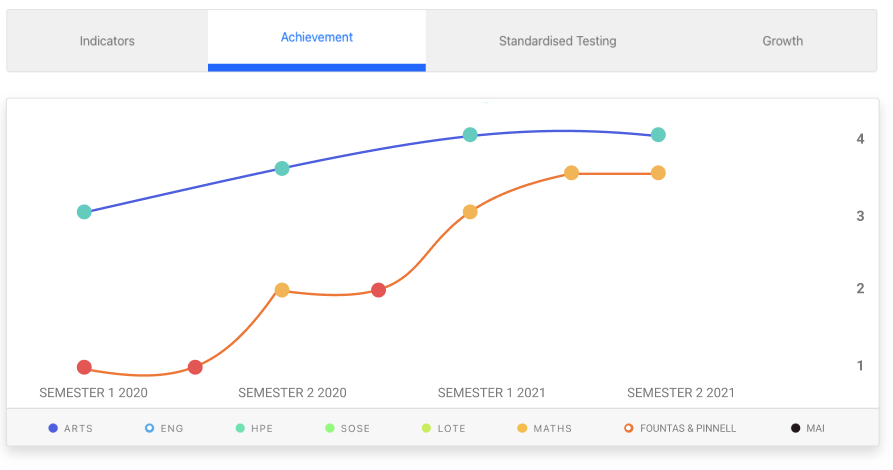
Primary school teachers may take this a step further and look at the same metrics for specific strand information - Reading is a good example of this. What NAPLAN tells us about a student's proficiency in reading will be a useful backdrop for the more real-time information collected in assessments such as Fountas & Pinnell. Having an easily accessed, longitudinally tracked reading record, particularly when compared to other results (pictured below) provides great insight into points of growth and challenge for your students.

For English and Maths teachers, I'd go a step further and examine NAPLAN and your PAT tests for the questions in each strand where students typically come unstuck. A common approach used for this kind of analysis is the Guttman chart and the analysis of each student's zone of proximal development. Knowing the exact NAPLAN and PAT questions where your students began to struggle can give you a crystal clear indication of their capability.
These two activities should help you answer questions on whether your first unit of work must start with greater focus on definitions or include a revision of materials underpinning the curriculum you need to cover.
My subject
Still in pre-school-year, I'd want to know who of my new students likes my subject (and potentially doesn't...), who has excelled and who may need support. Seeing my class's results for my Learning Area over time will certainly be helpful but I'd also want a clear picture on:
- Who has required modified tasks and how were they modified?
- To what extent have the curriculum strands that I'll cover this semester been scaffolded, or already covered? What can an analysis of performance against the curriculum strands tell me about where to start my instructional materials and what can be skipped or simply revised?
During the school year
Term holiday planning
May schools will supplement NAPLAN assessments with a range of PAT tests or the Allwell test. NAPLAN results are less useful if you're teaching Grade 4 or 6 or you've got Year 8s or 10s, these results are now dated so results from PAT or Allwell tests become a useful counterpoint. These external assessments measure aptitude rather than performance against a curriculum, so there's no likely to be a need to radically rethink what you've got planned for next Term. They do, however, provide further evidence of whether a student's capability and their performance line up.
Task work: formative assessment
In my experience, this is the data that is most critical to informing changes we need to make to our instructional material. Formative assessment is second-nature to K-12 teachers, so acknowledging the considerable time and expertise that goes into this, I'll stay in my lane and restrict comments to analytics!
Your Learning Management System and external content providers such as Edrolo, Education Perfect and Essential Assessment have the capability to assess students against the curriculum at points of your choosing. Objectively assessed tasks, i.e. quizzes or multiple choice questions, which do not require teacher judgement (and thereby do not require assessment time) can be a litmus test for the extent to which a class is:
- engaging with the curriculum content.
- understanding the content and responding in a way that is appropriate to the task.
Seeing all of this data in one place as it transpires in real-time, particularly as students are preparing for a major assessment provides a snapshot of what material has landed well and what needs redressing.
Seen in retrospect, a comparison of formative assessment results to summative assessment results will also help you determine which of the preparatory tasks you'd set should be kept for the next time the unit of work is done.
Evaluating impact
The final suggestion I have concerns my area of passion - using technology to make the connections between our assessment practices and the curriculum frameworks which underpin our instructional materials explicit. Here, technology has a practical role to play in that the individual criterion in your assessment rubrics can be linked to curriculum codes. Whether your school follows the Victorian Curriculum, the NSW Syllabus or the National Curriculum, having rubric criteria linked in this way allows for the analysis of student performance and growth by Learning Area Strand.
What I like about this is that summative assessment when done in this way can be both a measure of performance and a measure of progress against the curriculum. Beyond the performance grade, this approach has the potential to:
- provide both teacher and student a clear indication of skill growth over time (I've written more on how analytics can help improve student agency).
- provide equal importance to evaluating teaching's impact on progression as to a student's performance against the objectives.
In concluding I want to point out a couple of (probably obvious) things. This list is far from exhaustive is the first. The second is that while all of this analysis is possible without data analytics software, it is probably out of reach without a solution like Albitros. We automate the collection, calculations and visualisations required to conduct the activities described above.
If you're doing any of this manually, why not get in touch for a demo?
Cover photo by Jess Bailey on Unsplash.