Data visualisation is the representation of data in a graphical format. Good data visualisations are easy to understand, and should immediately convey a message or story about the data being represented.
Humans like viewing data and numbers in graphical formats because we find them easier to interpret. It makes it easier for us to identify trends and patterns in the data, so we are immediately more engaged in the story that the data tells.
For schools, data visualisation is incredibly important because it gives teachers, students, and parents an easy way to make use of the large amounts of data that schools accumulate. Visualisations can turn data into actionable insights for everybody.
Why visualise data in schools?
Data visualisation in schools helps to make sense of large amounts of data. If you have questions about student attendance, academics, growth, or progression, often there is a vast amount of data to draw from. Visualising this data can turn a spreadsheet of thousands of lines into a beautiful, engaging, graphical representation that tells a story. Which would you rather look at?
A good example is this student attendance visualisation from one of Intellischool's products, Albitros.
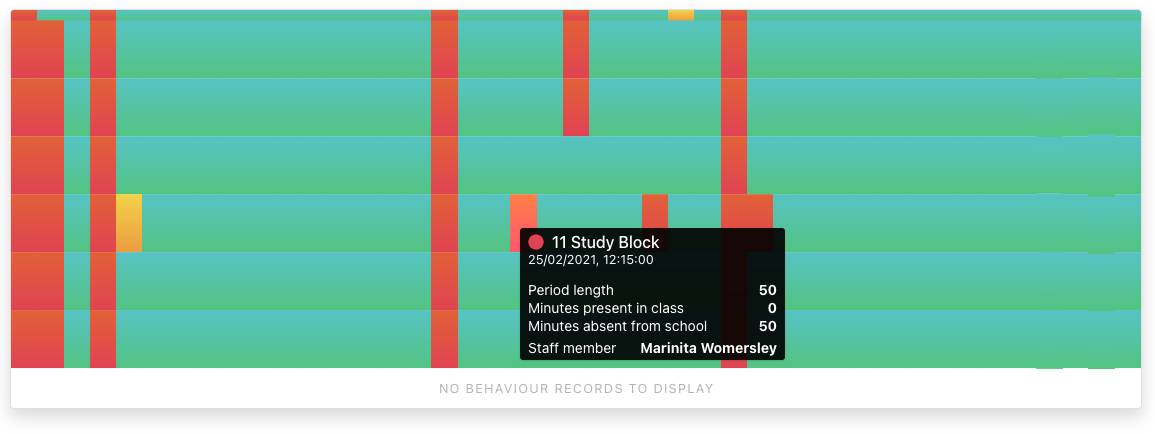
This chart immediately tells us a story: that this student regularly fails to attend their Study group, as illustrated by the repeated absences or partial absences on one line.
Learning analytics for K-12 schools provide teachers with graphical data stories that help them interpret, analyse, and sometimes predict student behaviour and performance - informing them when intervention may be required.
Why is data visualisation important?
When it comes to learning analytics, the potential of data visualisation is limitless in its applications. Some examples of the ways schools are using data visualisations include:
- Understanding and improving student engagement;
- Identifying students at risk;
- Cross-comparing between different types of data;
- Measuring and managing workloads - for both teachers and students;
- Encouraging consistent and timely feedback; and more.
Schools collect vast amounts of data every day. Interpreting each collected data point without data visualisation is an insurmountable task - and oftentimes signs in those data points are missed as a result. Data visualisation solves that problem for educators and students alike.
What are the benefits of data visualisation?
You will have heard the terms "data literacy" and "data-driven decision making". They might sound like buzzwords, but their actual meaning is incredibly relevant: it simply means that you can make decisions based on data, rather than having to guess.
Graphical representations - instead of columns and rows numbering in their thousands (or even millions) - help educators and students make well-informed decisions quickly.

"Data has a better idea" by Franki Chamaki on Unsplash
What makes a good data visualisation?
"There are two goals when presenting data: convey your story and establish credibility."
- Edward Tufte
Shachee Swadia quite eloquently penned an article for Towards Data Science that articles five key principles to create compelling and competent visualisations:
- Tell the truth - inform your audience, don't influence them;
- Know your audience - show what you have in a way they want to see it;
- Choose the right chart - the right chart enhances information, the wrong one conceals insights;
- Emphasise the most important facts - omit the insignificant to highlight the essential; and
- Form should follow function - the purpose of data visualisation is insights, not pictures.
How can I visualise data at my school?
Check out Albitros, Intellischool's advanced analytics tool designed specifically for K-12 schools. Albitros provides a suite of ready-made, easy-to-interpret and immediately accessible dashboards for schools.